Introduction
For quick-service restaurants (QSRs), a fast drive-thru is not only about serving customers quickly. It is about identifying where delays occur, understanding why they happen, and continuously improving the operation. Even a few extra minutes during peak hours can create longer queues, increase customer waiting time, and put additional pressure on restaurant staff.
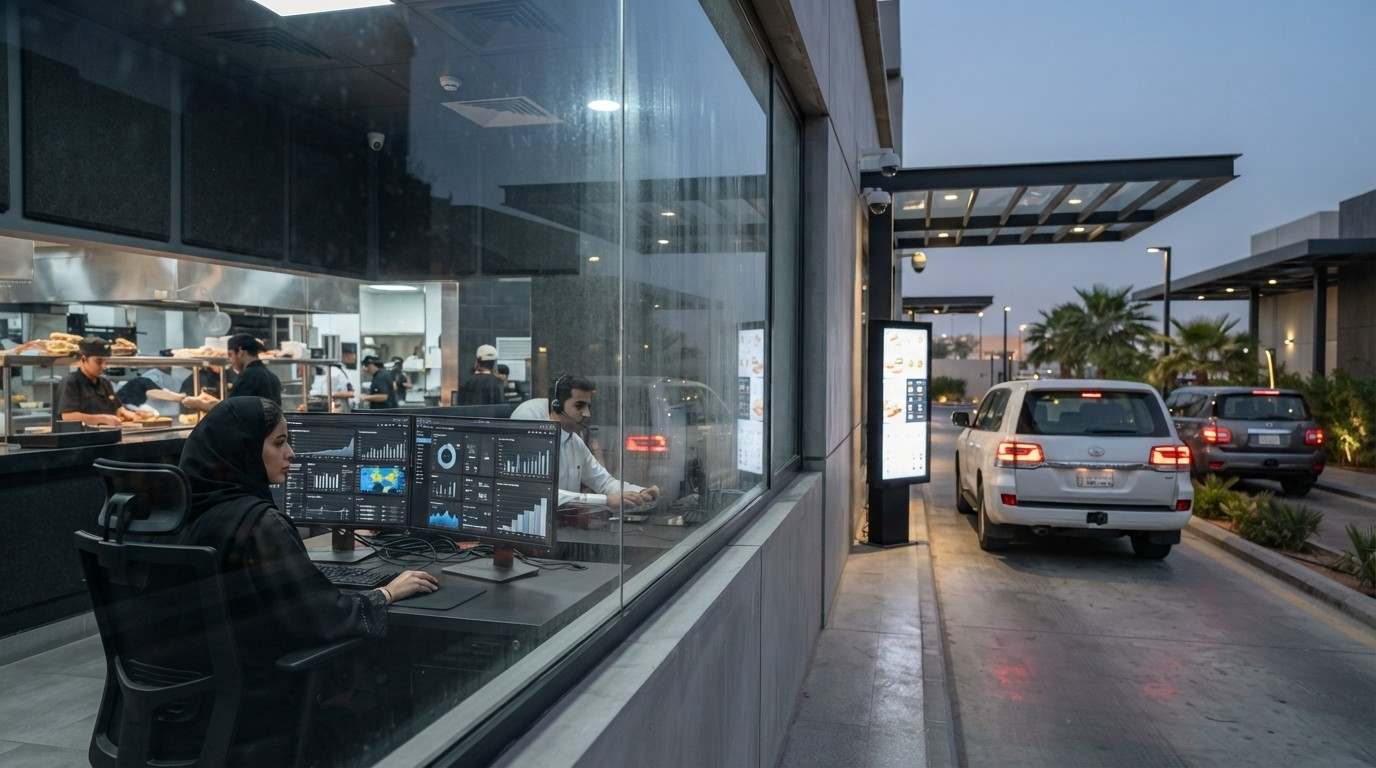
This is where drive-thru analytics becomes valuable. Instead of relying only on manual observation, QSR operators can use real-time operational data to identify bottlenecks, analyze performance, optimize workflows, and monitor improvements across locations.
A structured approach can be summarized as:
Measure → Identify Bottleneck → Analyze → Optimize → Monitor
With the right drive-thru performance monitoring system, this process can help restaurants improve drive-thru speed of service, operational efficiency, order accuracy, and overall QSR performance.
What Is Drive-Thru Analytics?
Drive-thru analytics involves collecting and analyzing operational data from different stages of the drive-thru journey. This can include ordering time, queue time, service time, pickup delays, and overall transaction time.
The purpose is not simply to collect numbers. The real value comes from using those numbers to identify operational problems and take corrective action.
For example, if a restaurant consistently experiences longer ordering times during lunch, analytics can help management investigate whether the issue is related to communication, staffing, order complexity, or workflow.
This makes analytics an important part of modern QSR performance monitoring.
1. Measure Drive-Thru Performance
The first step toward improvement is understanding the current performance of the operation.
A drive-thru analytics solution can provide visibility into key operational indicators such as:
- Total drive-thru time
- Queue and waiting time
- Ordering time
- Service time
- Pickup time
- Peak-hour performance
- Branch-level performance
- Order processing delays
The objective is to establish a reliable performance baseline.
For multi-location QSR operators, this becomes particularly important because every branch can operate differently. One restaurant may have excellent ordering performance but slow pickup, while another may experience excessive queues during specific periods.
Without consistent performance data, these differences can be difficult to identify.
2. Identify Operational Bottlenecks
Once performance data is available, the next step is identifying where delays are occurring.
A restaurant may have an acceptable overall drive-thru time, but the underlying data could reveal a specific stage that is causing the delay.
For example:
Long ordering time → Communication issue
If customers are spending too much time at the ordering point, management can review speaker communication, employee response time, menu complexity, or order-taking processes.
Order confirmation delays → Verification workflow issue
If there is a significant delay between order entry and confirmation, the restaurant can review how orders are verified and communicated between the drive-thru and internal systems.
Long queue → Staffing or capacity issue
If queues increase significantly during peak periods, managers can examine staffing levels, lane capacity, order complexity, and customer arrival patterns.
Slow pickup → Kitchen coordination issue
If customers complete ordering quickly but spend considerable time waiting for their food, the problem may be related to kitchen preparation, order prioritization, or coordination between front-of-house and kitchen teams.
This is where drive-thru performance monitoring becomes more than a reporting tool. It helps management determine where operational attention is required.
3. Analyze Why Performance Is Changing
Identifying a bottleneck is only the beginning. The next step is understanding why it is happening.
For example, suppose a QSR branch shows increased drive-thru times between 12 PM and 2 PM.
Instead of simply concluding that the restaurant is slow, management can compare performance across different time periods and operational stages.
Questions may include:
- Is the delay limited to lunch hours?
- Is ordering taking longer than usual?
- Is the kitchen struggling with order volume?
- Is staffing sufficient during peak periods?
- Are certain branches consistently slower?
- Does the problem occur on specific days?
- Is pickup time increasing while ordering time remains stable?
This type of analysis helps management move from “performance is declining” to “this specific operational stage requires attention.”
4. Optimize the Drive-Thru Workflow
After identifying the cause of a bottleneck, QSR operators can make targeted operational improvements.
For example, if analytics shows that communication is contributing to longer ordering times, the restaurant can review its drive-thru communication equipment and employee workflow.
If queue times increase during predictable peak periods, managers can review staff allocation and ensure sufficient team members are available when demand is highest.
If pickup delays are creating longer total transaction times, restaurant management can examine kitchen coordination and order preparation processes.
This targeted approach is more effective than making broad operational changes without knowing where the problem exists.
The goal of drive-thru optimization is to improve the specific stages that are affecting overall performance.
5. Compare Branch Performance
For QSR brands with multiple locations, centralized performance monitoring can provide another important advantage.
A restaurant group may have dozens or hundreds of branches, and manually checking every location can be difficult.
A centralized drive-thru analytics solution can help management compare operational KPIs across branches and identify locations that require additional attention.
For example:
Branch A: Consistently meets target service times
Branch B: Longer ordering times
Branch C: High peak-hour queue times
Branch D: Longer pickup times
This comparison allows management teams to investigate underperforming locations and understand what operational practices may need to be improved.
It can also help identify branches that are performing consistently well and provide useful operational benchmarks for other locations.
6. Optimize Peak-Hour Performance
Peak hours are often when drive-thru operations face the greatest pressure.
Higher customer volume can expose weaknesses in staffing, communication, kitchen coordination, and order processing.
Drive-thru analytics allows QSR management to identify when performance deteriorates and determine which operational stage is responsible.
For example, if a branch performs efficiently throughout most of the day but experiences significant delays between 7 PM and 9 PM, management can investigate staffing and capacity specifically for that period.
Instead of applying the same staffing approach throughout the day, operators can use performance data to make more informed decisions about resource allocation.
This can support better drive-thru operational efficiency while helping teams manage demand more effectively.
7. Monitor Whether Improvements Actually Work
Optimization should not end after an operational change is implemented.
The final step is continuous monitoring.
Suppose a restaurant changes its staffing allocation after identifying long peak-hour queues. Management should then monitor subsequent performance to determine whether queue time and overall drive-thru time have improved.
The same process can be applied to communication improvements, workflow changes, kitchen coordination, or order verification.
This creates a continuous improvement cycle:
Measure → Identify → Analyze → Optimize → Monitor → Improve Again
Over time, this approach can help QSR operators build more consistent and measurable operational processes.
How FAMA Technologies Supports Drive-Thru Performance Monitoring
For multi-location QSR businesses, having access to operational information from different branches can make performance management easier.
FAMA Technologies provides technology solutions for QSR drive-thru operations through its On-Go Drive-Thru Solution, combining drive-thru communication, ordering, timing, and operational technologies.
Its cloud-based capabilities can support remote access to real-time dashboards and reporting, allowing management teams to monitor performance across multiple locations without relying entirely on individual branch-level reporting.
This centralized approach can help QSR operators identify performance differences, investigate bottlenecks, and make data-informed operational decisions.
For businesses looking to improve drive-thru speed of service, drive-thru optimization, and QSR performance monitoring, combining operational technology with analytics can provide greater visibility into what is happening across the drive-thru network.
Conclusion
Improving drive-thru performance is not simply about making employees work faster. It requires understanding where time is being lost and why.
Drive-thru analytics provides the data needed to identify operational bottlenecks, while performance monitoring helps management determine whether corrective actions are actually improving results.
From reducing ordering delays and managing queues to improving pickup coordination and comparing branch performance, a structured analytics approach can support better drive-thru operational efficiency.
For growing QSR brands, the objective should be continuous improvement:
Measure the operation. Identify the bottleneck. Analyze the cause. Optimize the workflow. Monitor the results.
With centralized visibility and real-time reporting, solutions such as FAMA Technologies’ On-Go Drive-Thru Solution can help multi-branch QSR operators turn operational data into actionable improvements.