Introduction
For quick-service restaurants (QSRs), a fast drive-thru is not simply about serving more vehicles. Restaurant operators also need to understand how quickly orders are processed, how accurately they are fulfilled, how long customers wait, and where operational bottlenecks occur.
This is where drive-thru analytics becomes valuable.
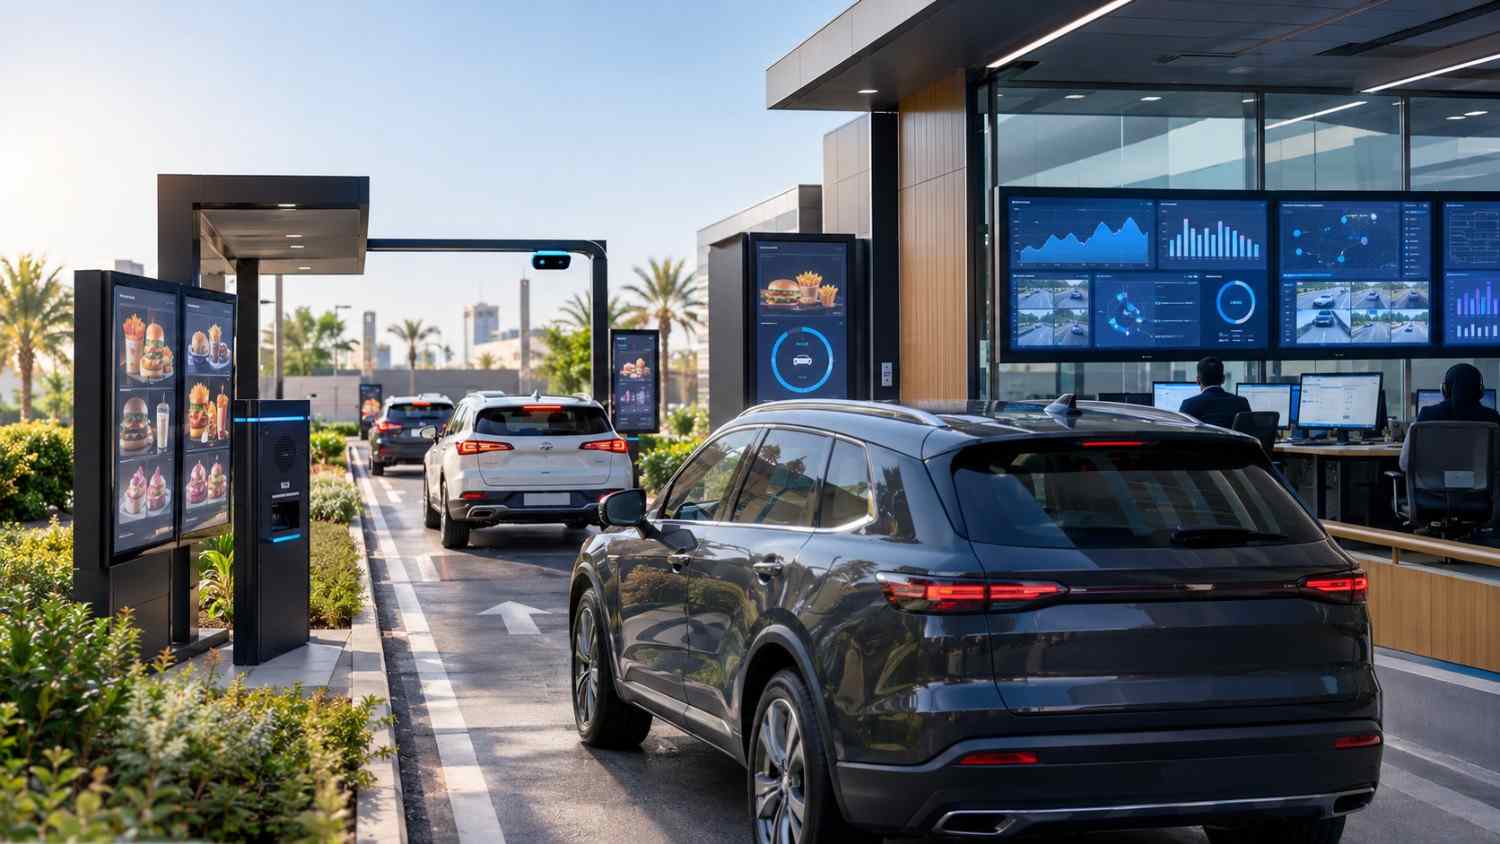
Instead of relying only on staff observations or customer feedback, QSRs can use technology to collect operational data across the drive-thru journey. Metrics such as service time, queue time, vehicle count, order accuracy, lane utilization, and peak-hour performance can provide a clearer picture of how each location is performing.
For multi-location restaurant groups, drive-thru performance analytics can also help standardize KPIs and identify differences between individual branches.
What Is Drive-Thru Analytics?
Drive-thru analytics is the process of collecting and analyzing operational data from a restaurant’s drive-thru to understand performance and customer experience.
A comprehensive restaurant drive-thru analytics strategy can measure several stages of the customer journey, including:
- Vehicle arrival
- Queue and waiting time
- Ordering time
- Order confirmation
- Service time
- Pickup time
- Vehicle throughput
- Peak-hour demand
- Order accuracy
- Store-level performance
The purpose is not simply to collect numbers. The data should help restaurant operators understand where delays, inefficiencies, or customer-experience issues may be occurring.
Why Drive-Thru KPIs Matter for QSRs
A drive-thru operation involves several connected processes. A delay at one stage can affect everything that follows.
For example, long queue times can indicate high demand, insufficient staffing, lane limitations, or an operational bottleneck. Similarly, repeated orders or order corrections may indicate communication or confirmation issues.
By defining consistent drive-thru KPIs, QSR operators can monitor performance using measurable data rather than assumptions.
The most useful KPIs generally fall into four categories: speed of service, order accuracy, customer experience, and operational performance.
1. Measure Drive-Thru Speed of Service
Speed is one of the most important areas of drive-thru performance.
However, measuring only the total time a vehicle spends in the drive-thru may not provide enough information. Operators should break the customer journey into different stages.
Total Drive-Thru Time
Total drive-thru time measures how long a vehicle takes to complete the entire drive-thru process.
This can provide a high-level view of overall performance and help operators identify locations where customers are spending more time than expected.
Queue and Wait Time
Queue time shows how long customers wait before reaching the ordering point.
Monitoring this metric can help identify congestion during busy periods and provide insight into peak-hour demand.
Service Time
Drive-thru service time measures the time associated with serving the customer after the order process begins.
Comparing service times across different periods can help restaurant teams understand whether operational processes are keeping pace with demand.
Peak-Hour Performance
Average daily performance can sometimes hide short periods of significant congestion.
For this reason, QSRs should also analyze performance during breakfast, lunch, dinner, weekends, and other high-demand periods.
2. Measure Drive-Thru Order Accuracy
Speed alone does not define an efficient drive-thru.
A fast order that is incorrect can result in customer dissatisfaction, rework, and additional operational pressure.
Drive-thru order accuracy should therefore be measured alongside speed.
Technology can support this process through order confirmation and customer verification workflows.
Important indicators can include:
- Order confirmation frequency
- Repeated orders
- Order corrections
- Customer verification
- Order mistakes
- Repeated communication between customer and employee
When order accuracy data is reviewed alongside service-time data, QSR operators can better understand whether speed improvements are affecting the ordering process.
3. Measure Customer Experience
Customer experience is another important part of QSR analytics.
A customer may complete an order within an acceptable timeframe but still have a poor experience because of unclear communication, excessive waiting, or problems during pickup.
Drive-thru analytics can therefore be used to examine different customer touchpoints.
Waiting Experience :
Monitoring queue and waiting times can help identify periods when customers experience congestion.
Communication Quality :
The drive-thru communication system plays an important role in the ordering experience. Clear communication between customers and restaurant staff can help reduce misunderstandings and repeated interactions.
Ordering Experience :
Operators can examine whether customers are experiencing repeated order confirmations, delays, or unnecessary communication during the ordering process.
Pickup Experience :
The final stage of the drive-thru journey also matters. Delays between ordering and receiving the order can affect the customer’s overall perception of service.
4. Measure Operational Performance
Beyond individual customer journeys, restaurant operators should look at broader operational metrics.
Car Count :
Vehicle tracking and car-count data can show how many vehicles are entering the drive-thru during specific periods.
This helps operators understand demand patterns and compare traffic between different days and time periods.
Lane Utilization :
For restaurants with multiple lanes or specific lane configurations, utilization data can provide insight into how effectively available drive-thru capacity is being used.
Peak Demand :
Understanding when demand increases allows restaurant managers to compare staffing and operational capacity with actual traffic patterns.
Store-Level Performance :
For QSR groups with multiple branches, performance should be analyzed at the individual store level as well as across the entire network.
This can help identify locations requiring operational review, training, or technology improvements.
Combining Drive-Thru Technology for Better Analytics
Accurate analytics depends on collecting information from the right points in the drive-thru journey.
A combination of Drive-Thru Timer, Vehicle Tracking, iCOD, and Cloud Reporting can provide a more complete operational view.
Drive-Thru Timer :
A drive-thru timer can help measure service speed and vehicle movement through different stages of the drive-thru process.
Instead of relying on manual observations, restaurant teams can use measurable timing information to understand performance.
Vehicle Tracking :
Vehicle tracking can provide information about vehicle movement and traffic patterns.
Combined with car-count data, this can help QSR operators understand demand and identify busy periods.
iCOD :
iCOD can support the communication and ordering workflow between the customer and restaurant team.
When ordering technology is connected with broader drive-thru processes, operators can gain better visibility into how communication and ordering contribute to overall performance.
Cloud Reporting :
Cloud-based reporting can bring operational information together in a centralized environment.
For multi-location QSRs, this can make it easier to review performance across branches, identify trends, and compare standardized KPIs.
How FAMA Technologies Supports Drive-Thru Performance Monitoring
FAMA Technologies‘ On-Go Drive-Thru is designed as an integrated drive-thru technology ecosystem that brings together multiple technologies supporting modern QSR operations.
The solution can incorporate technologies such as drive-thru communication, vehicle tracking, timers, car counting, and cloud-based management and reporting, depending on deployment requirements.
This integrated approach can help QSR operators move beyond simply installing drive-thru equipment and instead create a technology environment where operational performance can be measured more systematically.
For multi-location restaurant groups, this can be particularly useful because standardized technology and reporting can provide a consistent framework for evaluating drive-thru performance across different branches.
By combining speed measurements, vehicle data, ordering communication, and cloud reporting, restaurant operators can develop a more complete understanding of what is happening throughout the drive-thru journey.
Using Analytics to Identify Operational Bottlenecks
The real value of drive-thru performance analytics comes from using data to identify where problems occur.
For example:
High vehicle count + increasing queue time
→ May indicate capacity or staffing pressure during peak periods.
Fast ordering + slow pickup
→ May indicate a bottleneck further inside the restaurant.
Long ordering time + repeated communication
→ May indicate communication or ordering-process issues.
High vehicle traffic + low throughput
→ May require an operational review of the drive-thru workflow.
Analytics does not automatically determine the cause of a problem. Instead, it provides measurable information that restaurant teams can investigate alongside staffing, processes, equipment, and customer feedback.
Building a Data-Driven Drive-Thru Strategy
QSR operators should establish a consistent set of KPIs rather than tracking every available metric without a clear purpose.
A practical framework can include:
- Measure vehicle traffic and drive-thru times.
- Analyze speed, order accuracy, and customer-experience indicators.
- Compare performance across different periods and locations.
- Identify recurring bottlenecks.
- Review staffing, processes, and technology.
- Improve the relevant operational area.
- Monitor performance after changes are implemented.
For multi-location restaurants, this process can be repeated across branches using standardized KPIs and reporting.
Conclusion
A modern QSR drive-thru should be measured as a complete customer and operational journey rather than through a single speed metric.
Drive-thru analytics can help restaurant operators understand speed of service, queue times, order accuracy, vehicle traffic, lane utilization, peak-hour demand, and customer-experience indicators.
Technologies such as Drive-Thru Timer, Vehicle Tracking, iCOD, and Cloud Reporting can work together to provide a broader view of drive-thru performance.
FAMA Technologies’ On-Go Drive-Thru brings multiple drive-thru technologies together within an integrated ecosystem, helping QSR operators build a more structured approach to measuring and managing drive-thru operations.
For restaurant groups looking to improve operational visibility, the goal is not simply to collect more data. It is to measure the right KPIs, understand where bottlenecks occur, and use reliable performance information to support better day-to-day drive-thru management.